How To Create SEO Reporting Dashboard In Google Looker Studio: A Complete Guide
Want your brand to be listed first on SERPs? That’s what everyone wants. Getting there isn’t easy by crafting compelling content alone. You need to put in time, SEO effort, and make data-driven decisions. But how do you make data-driven decisions when there is a lot of data to track and examine? You will need a sophisticated tool such as Looker Studio for SEO, which provides you with a simple, quick overview of your activities. In this blog, let’s learn more about this and how you can create SEO dashboard in Looker Studio with minimal effort.
What is an SEO reporting dashboard?
Consider the SEO dashboard as the central digital hub that shows the entire web analytics data. Digital marketers can utilize various KPIs and essential metrics to understand SEO performance from various angles. As we know, websites need SEO to achieve online visibility and rankings. Understanding the different SEO metrics helps businesses know the best-converting keywords, best-performing web pages, and web pages that need to be optimized for search.
KPIs to include in the SEO reporting dashboard
As explained above, utilising various key metrics is essential to understand SEO performance and make data-driven decisions. But how to know what KPIs should be included in the first place? In Looker Studio, data is divided into two components: metrics and dimensions, which are used to structure reports effectively.
Metrics are used to measure the performance of the SEO campaign. This includes clicks, impressions, CTR, average position, etc. In contrast, dimensions are descriptive categories utilized for organizing and segmenting data. They help with breaking down metrics in various groups. The following are some of the various KPIs that must be included in a GA4 Looker Studio template.
Impressions
Impressions are defined as the number of times an ad is displayed to the customer, regardless they click it or not. It happens whenever users launch an app, visit a website, etc. Impressions are important because they represent the total number of people who have viewed an ad on a given platform. The higher the numbers, the higher the reach of the ad campaign.
Total Clicks
Whenever you launch a personalized ad campaign, it will be clicked by the intended target audience. So many people will make a click, and how to measure that? With total clicks, you know all of the clicks that were made on your campaign. Whether they were unique or not, it doesn’t matter. As long as a click was made, it is counted. PPC is an example of this.
Click-Through-Rate (CTR)
Another important metric to be included is click-through rate. This is defined as the percentage of the number of clicks your ad receives divided by the number of times your ad is shown. The formula for CTR is as follows:
(Clicks ÷ impressions) = CTR
For example, if your ad campaign received 20 clicks and 200 impressions, then the CTR would be 10%. CTR is generally used to measure the success of website ad campaigns, email campaigns and more. Having a high CTR means that your ad campaign is working as intended, and customers find it relevant.
Device Type
Customers visiting your website view and click your ad, but which device do they use, and how many percentage of users are using such devices? That is something you can measure using the Device Type KPI. You need to know how users are accessing your site so that you can optimize their web browsing experience on their preferred devices.
Create SEO dashboard in Looker
Before you create an SEO dashboard in Looker, you must have access to two things: Google Search Console (GSC), which must be installed first & Looker Studio, in which the data source must be added. Let’s understand the process through the following steps:
Step 1: Install Google Search Console (GSC)
Using GSC, you can track your website’s SEO performance. To set up the tool, open Google Search Console and log in.

Once logged in, you must add a website property. This is achieved by clicking the “Add property” tab on the upper left side.

Upon clicking, you will be asked to choose one of the two property types, Domain & URL prefix. Choose the latter on the right and enter your site URL.

Once you enter the URL, the next stage is verifying the property, and there are two ways in which you can do this: either via Google Analytics or Google Tag Manager. Click on Google Analytics to verify. If that doesn’t work, choose Google Tag Manager. Allow the tool to collect data for a couple of days, after which you will be presented with a report similar to the one shown below:

Here you can see various metrics such as total clicks, total impressions, and more. This collected data can be transferred to Looker Studio. Now let’s move on to the Looker Studio SEO dashboard.
Step 2: Setting up Looker Studio for SEO
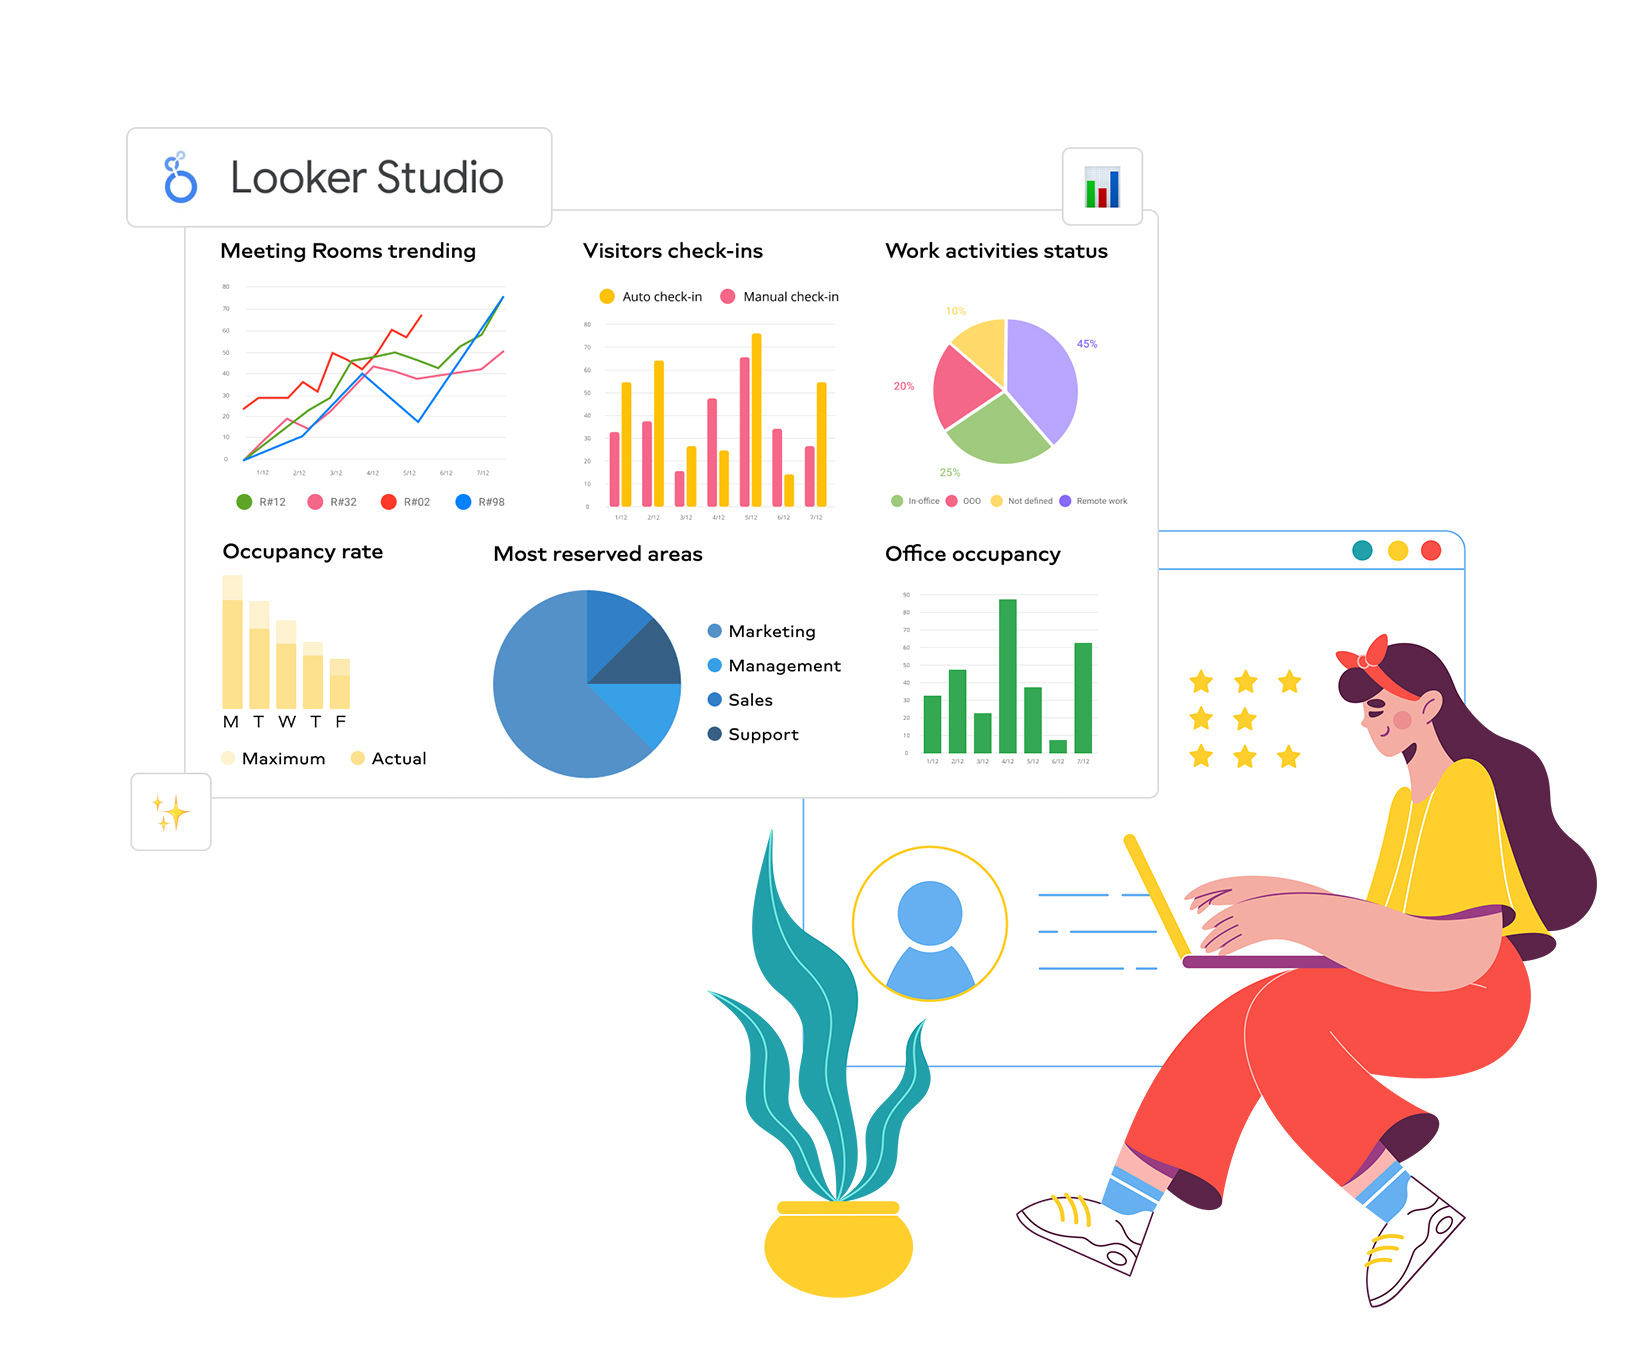
Before explaining the process, let’s understand what the tool is first. Looker Studio is a free SEO data visualization tool developed by Google. The tool allows you to create an interactive SEO reporting dashboard by connecting multiple data sources, such as GSC, and other third-party tools and visualizing them in different formats. This is a powerful tool that helps transform raw, unfiltered data into easy-to-understand visualizations.
When comparing Data Studio vs Looker, it’s important to note that Google rebranded Data Studio into Looker Studio to align with their broader business intelligence tools. So essentially, if you’re wondering whether to use Data Studio or Looker Studio—the answer is they’re now one and the same.
Open the Google Looker Studio SEO template and log in with your Google email.

Once opened, click the “Create” button at the top left, then click Data source. Type in “Search Console” in the Search bar and choose the official Search Console.

Once you are inside, you have to choose the domain or URL you want to add the data from. This is the place where you added your site URL earlier in the Google Search Console. Next to the sites, you can see a Tables section, in which you must choose ”Site impression”.

Give a name to the data source. Once done, you have to add it to the Looker Studio. To do that, click “Add Data”, choose the relevant connector, and authorize access. After that, click on create report, upon which you will get a prompt to confirm. Confirm it, and you are done.
Great, you have now learned how to add the data source. The next step is adding the metrics since Looker Studio provides a blank dashboard. Let’s add some metrics and fill the canvas.
First, click on “Add a control”, then ” Date range control”, and drag it onto the canvas.

Repeat the same process by clicking on “Add a chart”. Here you can see various metrics such as Scorecard, Time series, Bar, etc. For the time being, choose both scorecard and time series and drag them onto the canvas.

After adding all these metrics, you should see a canvas something like this, shown below.

This is the basics of how you connect a data source, add metrics to create SEO dashboard in Looker
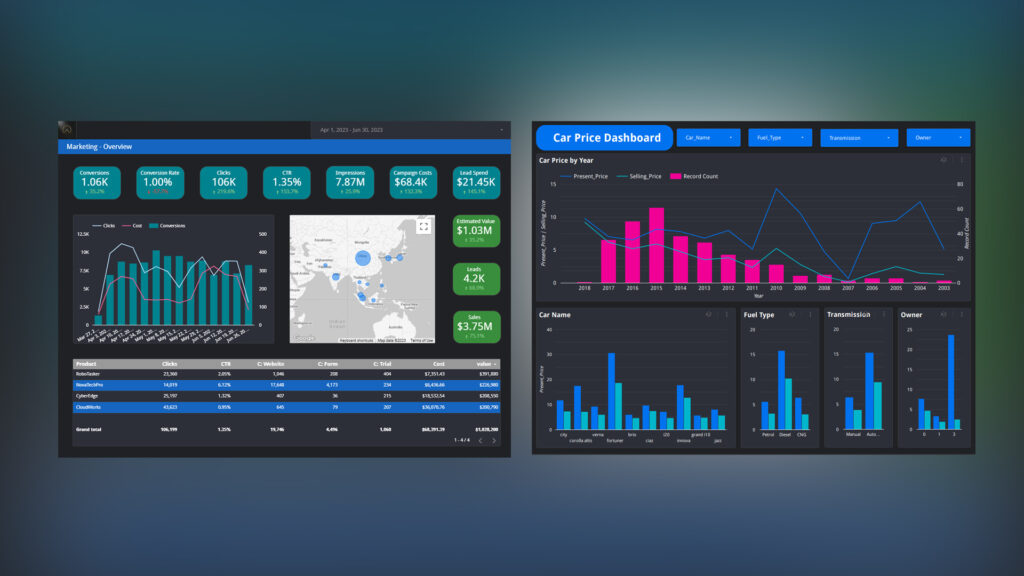
Do remember that designing a comprehensive dashboard requires dedication and time. You can further customize this by adding multiple data sources and other metrics. An example of a fully customized Google Looker studio seo template would be something like the image below:

Effective Tips To Create Looker Studio SEO Dashboard
Creating an SEO report in Looker Studio SEO dashboard isn’t just about gathering data. It’s about making clear business insights using the collected data. Even though Looker Studio does provide a plethora of performance measuring metrics, having a well-detailed report is crucial. There are various tips that knowing beforehand makes your job a lot easier, more on that below:
Gather data from multiple sources
In our Google Looker Studio tutorial, we explained how to add data sources from Google Search Console. If you are looking to create a detailed report, you’ll have to go beyond one data source. Adding data from multiple platforms other than GSC, such as Google Analytics, Google Ads, Semrush, etc, gives you a complete view.
Incorporate Visual Elements
If your report only contains text and numbers, it can be quite overwhelming and less appealing to users. Adding visual elements makes the report unique and improves readability. Charts, scorecards, graphs, etc, are some of the visual elements that can be added with ease. Highlighting key insights through visuals makes it easy to spot.
Offer Actionable Insights
Your data is only good if it leads to a particular course of action. Collecting data is one thing, however, it has to offer solutions on how to improve the current strategy, highlight key trends and opportunities. So, instead of just adding and presenting the data, make sure it offers value.
Winding Up
Creating a well-detailed SEO dashboard in Looker Studio is essential for businesses looking to enhance their online presence. As we’ve seen in this Google Looker Studio tutorial, gathering data from multiple sources and visualising it provides valuable insights that help make data-driven decision-making. By leveraging the top search engine optimization services in UAE from a reputable agency, you can learn more about making a Looker Studio SEO dashboard and gain a clear understanding of your website’s performance.
Related Post
Publications, Insights & News from GTECH